Ken Research Logo

Spain Smart Mobility Bike-Sharing Systems Market

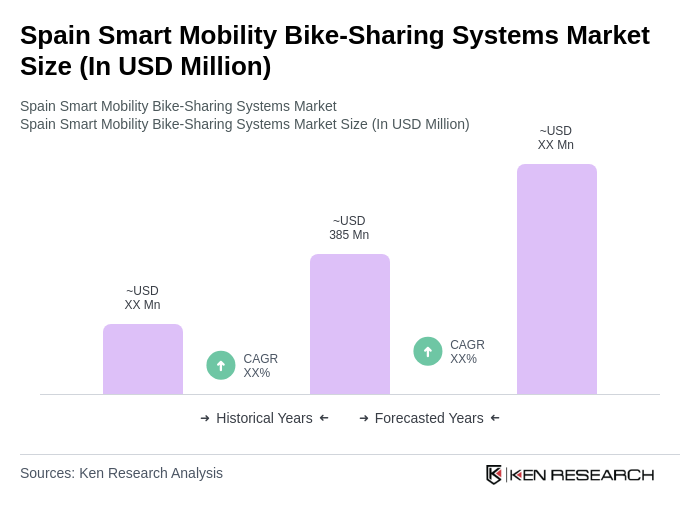
Spain Smart Mobility Bike-Sharing Systems Market is worth USD 385 million, with electric bikes dominating and individual users leading, fueled by sustainable transport trends.

Region:Europe

Author(s):Geetanshi

Product Code:KRAA3652

Pages:99

Published On:September 2025
About the Report

Base Year 2024

Spain Smart Mobility Bike-Sharing Systems Market Overview

  • The Spain Smart Mobility Bike-Sharing Systems Market is valued at USD 385 million, based on a five-year historical analysis. This growth is primarily driven by increasing urbanization, government initiatives promoting sustainable transport, and a growing awareness of environmental issues among consumers. The rise in bike-sharing schemes has also been fueled by technological advancements, making it easier for users to access and utilize these services through mobile apps and GPS tracking systems.
  • Key cities dominating the market include Barcelona, Madrid, and Valencia. These cities have implemented extensive bike-sharing programs supported by robust infrastructure, such as dedicated bike lanes and parking facilities. The high population density and tourist influx in these urban areas further contribute to the demand for bike-sharing services, making them pivotal players in the market.
  • The Spanish government has established comprehensive policies supporting bike-sharing services through the creation and funding of public bike sharing programs in major cities such as Barcelona, Madrid, and Seville, with these programs receiving financial support and infrastructure improvements from the government to encourage citizens to use bikes as a mode of transport. Additionally, the government has implemented regulations to ensure the safety and efficiency of bike sharing services, including guidelines for bike maintenance and user behavior.
Spain Smart Mobility Bike-Sharing Systems Market Size

Spain Smart Mobility Bike-Sharing Systems Market Segmentation

By Type:The market is segmented into various types of bikes, including Conventional Bikes, Electric Bikes, Cargo Bikes, Hybrid Bikes, and Others. Each type caters to different user preferences and needs, influencing the overall market dynamics. There is a growing trend towards electric bikes to cater to the increasing demand for eco-friendly transportation options, with companies expanding their fleets to include more electric bikes.
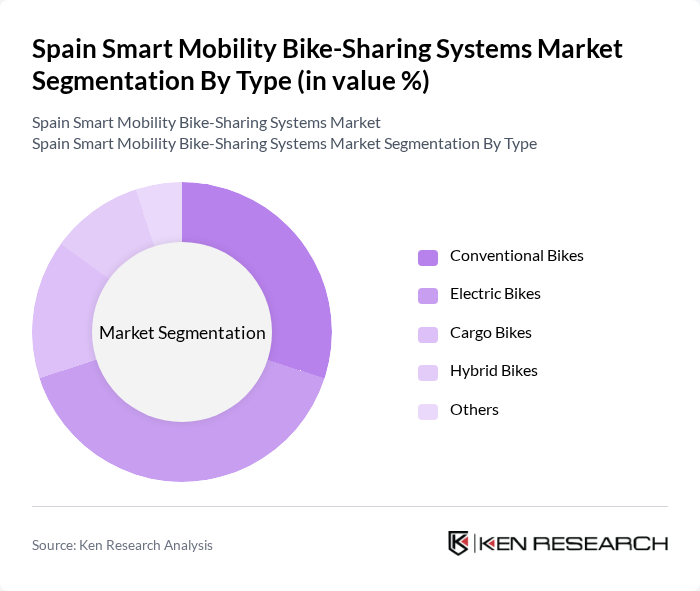
Spain Smart Mobility Bike-Sharing Systems Market segmentation by Type.

The Electric Bikes segment is currently dominating the market due to their convenience and efficiency, particularly in urban settings where users seek faster and less strenuous travel options. The increasing availability of electric bike-sharing services has attracted a diverse user base, including commuters and tourists. Additionally, the growing emphasis on eco-friendly transportation solutions has further propelled the demand for electric bikes, making them a preferred choice among consumers.

By End-User:The market is segmented based on end-users, including Individual Users, Corporate Users, Tourists, and Government & Municipalities. Each segment reflects different usage patterns and requirements, contributing to the overall market landscape.
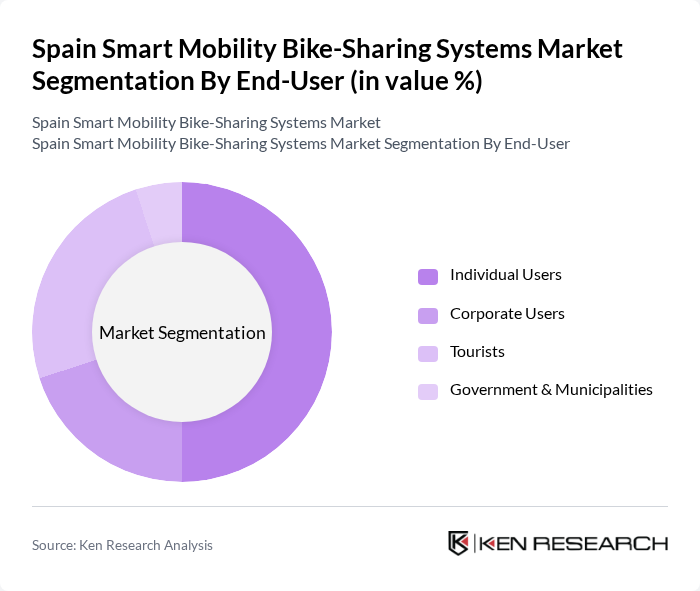
Spain Smart Mobility Bike-Sharing Systems Market segmentation by End-User.

The Individual Users segment leads the market, driven by the increasing number of urban residents opting for bike-sharing as a convenient and cost-effective mode of transport. This trend is further supported by the growing awareness of health benefits and environmental sustainability. Additionally, the rise in remote work has led to more individuals seeking flexible commuting options, solidifying the dominance of individual users in the bike-sharing market.

Spain Smart Mobility Bike-Sharing Systems Market Competitive Landscape

The Spain Smart Mobility Bike-Sharing Systems Market is characterized by a dynamic mix of regional and international players. Leading participants such as Bicing, Donkey Republic, PBSC Urban Solutions, Movus, Ofo, Mattia 46, Bike Tours Barcelona, Green Bikes, BICIMAD, Rutas Pangea, Eco Moving Sports, ByBike City, Lime, Jump Bikes, Reby contribute to innovation, geographic expansion, and service delivery in this space.

Bicing

2007

Barcelona, Spain

Donkey Republic

2013

Copenhagen, Denmark

PBSC Urban Solutions

2008

Montreal, Canada

Movus

2016

Madrid, Spain

Ofo

2014

Beijing, China

Company

Establishment Year

Headquarters

Group Size (Large, Medium, or Small as per industry convention)

Revenue Growth Rate (YoY)

Customer Acquisition Cost (CAC)

Average Ride Duration (minutes)

Fleet Utilization Rate (%)

Customer Retention Rate (%)

Spain Smart Mobility Bike-Sharing Systems Market Industry Analysis

Growth Drivers

  • Increasing Urbanization:Spain's urban population is projected to reach approximately 84% by the future, according to the World Bank. This rapid urbanization drives demand for efficient transportation solutions, including bike-sharing systems. Cities like Madrid and Barcelona are experiencing significant population growth, leading to increased congestion. The need for sustainable mobility options is critical, as urban areas face challenges related to traffic and pollution, making bike-sharing an attractive alternative for daily commuters.
  • Government Initiatives for Sustainable Transport:The Spanish government has committed to investing €1.6 billion in sustainable transport initiatives by the future, as part of its Green Deal. This funding aims to enhance bike-sharing infrastructure and promote eco-friendly transport solutions. Local governments are also implementing policies to reduce carbon emissions, which include expanding bike lanes and improving accessibility to bike-sharing services. Such initiatives are expected to significantly boost the adoption of bike-sharing systems across urban areas.
  • Rising Environmental Awareness:A recent survey by the Spanish Ministry of Ecological Transition indicated that 73% of Spaniards prioritize environmental sustainability in their transportation choices. This growing awareness is driving the demand for bike-sharing systems, as they offer a low-carbon alternative to traditional vehicles. The increasing focus on reducing greenhouse gas emissions aligns with Spain's commitment to achieving a 21% reduction in emissions by the future, further supporting the growth of eco-friendly mobility solutions like bike-sharing.

Market Challenges

  • Infrastructure Limitations:Despite the growth potential, Spain's bike-sharing systems face significant infrastructure challenges. According to the Spanish Cycling Federation, only 16% of urban areas have adequate cycling infrastructure. This lack of dedicated bike lanes and parking facilities can deter potential users, limiting the effectiveness of bike-sharing programs. Additionally, many cities are struggling to integrate bike-sharing with existing public transport systems, which hampers overall accessibility and convenience for users.
  • Competition from Other Mobility Solutions:The bike-sharing market in Spain is increasingly competitive, with alternatives such as electric scooters and ride-sharing services gaining popularity. In the future, the number of electric scooters in Madrid alone is expected to reach 21,000, according to local transport authorities. This competition can dilute the market share of bike-sharing systems, as consumers may opt for more convenient or faster options. The challenge lies in differentiating bike-sharing services to attract and retain users in a crowded mobility landscape.

Spain Smart Mobility Bike-Sharing Systems Market Future Outlook

As Spain continues to prioritize sustainable urban mobility, the bike-sharing market is expected to evolve significantly. Innovations in electric bike technology and mobile payment systems will enhance user experience and convenience. Additionally, the integration of bike-sharing with public transport networks will likely improve accessibility. The focus on smart city initiatives will further drive the adoption of bike-sharing systems, as cities aim to create more interconnected and environmentally friendly urban environments, fostering a culture of cycling and sustainable transport.

Market Opportunities

  • Expansion into Suburban Areas:There is a growing opportunity to expand bike-sharing services into suburban regions, where demand for sustainable transport is increasing. With suburban populations projected to rise by 6% by the future, bike-sharing can provide an effective solution for commuting to urban centers, reducing traffic congestion and emissions.
  • Integration with Public Transport Systems:Collaborating with public transport providers presents a significant opportunity for bike-sharing systems. By integrating services, cities can create seamless mobility solutions that encourage users to combine biking with public transport, enhancing overall accessibility and convenience for commuters, thereby increasing ridership and revenue.

Scope of the Report

SegmentSub-Segments
By Type

Conventional Bikes

Electric Bikes

Cargo Bikes

Hybrid Bikes

Others

By End-User

Individual Users

Corporate Users

Tourists

Government & Municipalities

By Subscription Model

Monthly Subscriptions

Annual Subscriptions

Pay-Per-Ride

Corporate Packages

By Distribution Channel

Mobile Apps

Kiosks

Website

Partnerships with Local Businesses

By Fleet Size

Small Fleet (1-50 Bikes)

Medium Fleet (51-200 Bikes)

Large Fleet (201+ Bikes)

By Geographic Coverage

Urban Areas

Suburban Areas

Tourist Areas

By Pricing Strategy

Premium Pricing

Competitive Pricing

Discount Pricing

Key Target Audience

Investors and Venture Capitalist Firms

Government and Regulatory Bodies (e.g., Ministry of Transport, Local Municipalities)

Manufacturers and Producers of Bike-Sharing Equipment

Distributors and Retailers of Bicycles and Accessories

Urban Planners and City Development Agencies

Technology Providers for Smart Mobility Solutions

Industry Associations for Sustainable Transportation

Financial Institutions and Banks Financing Mobility Projects

Players Mentioned in the Report:

Bicing

Donkey Republic

PBSC Urban Solutions

Movus

Ofo

Mattia 46

Bike Tours Barcelona

Green Bikes

BICIMAD

Rutas Pangea

Eco Moving Sports

ByBike City

Lime

Jump Bikes

Reby

Table of Contents

Market Assessment Phase

1. Executive Summary and Approach


2. Spain Smart Mobility Bike-Sharing Systems Market Overview

2.1 Key Insights and Strategic Recommendations

2.2 Spain Smart Mobility Bike-Sharing Systems Market Overview

2.3 Definition and Scope

2.4 Evolution of Market Ecosystem

2.5 Timeline of Key Regulatory Milestones

2.6 Value Chain & Stakeholder Mapping

2.7 Business Cycle Analysis

2.8 Policy & Incentive Landscape


3. Spain Smart Mobility Bike-Sharing Systems Market Analysis

3.1 Growth Drivers

3.1.1 Increasing Urbanization
3.1.2 Government Initiatives for Sustainable Transport
3.1.3 Rising Environmental Awareness
3.1.4 Technological Advancements in Mobility Solutions

3.2 Market Challenges

3.2.1 Infrastructure Limitations
3.2.2 Competition from Other Mobility Solutions
3.2.3 Regulatory Hurdles
3.2.4 Seasonal Demand Fluctuations

3.3 Market Opportunities

3.3.1 Expansion into Suburban Areas
3.3.2 Integration with Public Transport Systems
3.3.3 Development of Smart City Initiatives
3.3.4 Partnerships with Local Businesses

3.4 Market Trends

3.4.1 Growth of Electric Bike-Sharing
3.4.2 Adoption of Mobile Payment Solutions
3.4.3 Focus on User Experience and Convenience
3.4.4 Data-Driven Decision Making

3.5 Government Regulation

3.5.1 Emission Reduction Targets
3.5.2 Safety Standards for Bike-Sharing
3.5.3 Subsidies for Sustainable Transport
3.5.4 Local Government Policies Supporting Bike Infrastructure

4. SWOT Analysis


5. Stakeholder Analysis


6. Porter's Five Forces Analysis


7. Spain Smart Mobility Bike-Sharing Systems Market Market Size, 2019-2024

7.1 By Value

7.2 By Volume

7.3 By Average Selling Price


8. Spain Smart Mobility Bike-Sharing Systems Market Segmentation

8.1 By Type

8.1.1 Conventional Bikes
8.1.2 Electric Bikes
8.1.3 Cargo Bikes
8.1.4 Hybrid Bikes
8.1.5 Others

8.2 By End-User

8.2.1 Individual Users
8.2.2 Corporate Users
8.2.3 Tourists
8.2.4 Government & Municipalities

8.3 By Subscription Model

8.3.1 Monthly Subscriptions
8.3.2 Annual Subscriptions
8.3.3 Pay-Per-Ride
8.3.4 Corporate Packages

8.4 By Distribution Channel

8.4.1 Mobile Apps
8.4.2 Kiosks
8.4.3 Website
8.4.4 Partnerships with Local Businesses

8.5 By Fleet Size

8.5.1 Small Fleet (1-50 Bikes)
8.5.2 Medium Fleet (51-200 Bikes)
8.5.3 Large Fleet (201+ Bikes)

8.6 By Geographic Coverage

8.6.1 Urban Areas
8.6.2 Suburban Areas
8.6.3 Tourist Areas

8.7 By Pricing Strategy

8.7.1 Premium Pricing
8.7.2 Competitive Pricing
8.7.3 Discount Pricing

9. Spain Smart Mobility Bike-Sharing Systems Market Competitive Analysis

9.1 Market Share of Key Players

9.2 Cross Comparison of Key Players

9.2.1 Company Name
9.2.2 Group Size (Large, Medium, or Small as per industry convention)
9.2.3 Revenue Growth Rate (YoY)
9.2.4 Customer Acquisition Cost (CAC)
9.2.5 Average Ride Duration (minutes)
9.2.6 Fleet Utilization Rate (%)
9.2.7 Customer Retention Rate (%)
9.2.8 Pricing Strategy (Premium, Competitive, Discount)
9.2.9 Market Penetration Rate (Cities Covered / Total Major Cities)
9.2.10 User Satisfaction Score (NPS or equivalent)

9.3 SWOT Analysis of Top Players

9.4 Pricing Analysis

9.5 Detailed Profile of Major Companies

9.5.1 Bicing
9.5.2 Donkey Republic
9.5.3 PBSC Urban Solutions
9.5.4 Movus
9.5.5 Ofo
9.5.6 Mattia 46
9.5.7 Bike Tours Barcelona
9.5.8 Green Bikes
9.5.9 BICIMAD
9.5.10 Rutas Pangea
9.5.11 Eco Moving Sports
9.5.12 ByBike City
9.5.13 Lime
9.5.14 Jump Bikes
9.5.15 Reby

10. Spain Smart Mobility Bike-Sharing Systems Market End-User Analysis

10.1 Procurement Behavior of Key Ministries

10.1.1 Budget Allocation for Sustainable Transport
10.1.2 Decision-Making Processes
10.1.3 Evaluation Criteria for Bike-Sharing Systems

10.2 Corporate Spend on Infrastructure & Energy

10.2.1 Investment in Bike Infrastructure
10.2.2 Partnerships with Bike-Sharing Providers
10.2.3 Funding for Sustainable Initiatives

10.3 Pain Point Analysis by End-User Category

10.3.1 Accessibility Issues
10.3.2 Maintenance Concerns
10.3.3 Pricing Affordability

10.4 User Readiness for Adoption

10.4.1 Awareness of Bike-Sharing Benefits
10.4.2 User Experience with Existing Systems
10.4.3 Technological Familiarity

10.5 Post-Deployment ROI and Use Case Expansion

10.5.1 Measurement of User Engagement
10.5.2 Expansion into New Markets
10.5.3 Long-Term Sustainability Metrics

11. Spain Smart Mobility Bike-Sharing Systems Market Future Size, 2025-2030

11.1 By Value

11.2 By Volume

11.3 By Average Selling Price


Go-To-Market Strategy Phase

1. Whitespace Analysis + Business Model Canvas

1.1 Market Gaps Identification

1.2 Business Model Components


2. Marketing and Positioning Recommendations

2.1 Branding Strategies

2.2 Product USPs


3. Distribution Plan

3.1 Urban Retail vs Rural NGO Tie-Ups


4. Channel & Pricing Gaps

4.1 Underserved Routes

4.2 Pricing Bands


5. Unmet Demand & Latent Needs

5.1 Category Gaps

5.2 Consumer Segments


6. Customer Relationship

6.1 Loyalty Programs

6.2 After-Sales Service


7. Value Proposition

7.1 Sustainability

7.2 Integrated Supply Chains


8. Key Activities

8.1 Regulatory Compliance

8.2 Branding

8.3 Distribution Setup


9. Entry Strategy Evaluation

9.1 Domestic Market Entry Strategy

9.1.1 Product Mix
9.1.2 Pricing Band
9.1.3 Packaging

9.2 Export Entry Strategy

9.2.1 Target Countries
9.2.2 Compliance Roadmap

10. Entry Mode Assessment

10.1 JV

10.2 Greenfield

10.3 M&A

10.4 Distributor Model


11. Capital and Timeline Estimation

11.1 Capital Requirements

11.2 Timelines


12. Control vs Risk Trade-Off

12.1 Ownership vs Partnerships


13. Profitability Outlook

13.1 Breakeven Analysis

13.2 Long-Term Sustainability


14. Potential Partner List

14.1 Distributors

14.2 JVs

14.3 Acquisition Targets


15. Execution Roadmap

15.1 Phased Plan for Market Entry

15.1.1 Market Setup
15.1.2 Market Entry
15.1.3 Growth Acceleration
15.1.4 Scale & Stabilize

15.2 Key Activities and Milestones

15.2.1 Activity Timeline
15.2.2 Milestone Tracking

Research Methodology

ApproachModellingSample

Phase 1: Approach1

Desk Research

  • Analysis of government reports on urban mobility and transportation policies in Spain
  • Review of industry publications and market reports on bike-sharing systems
  • Examination of academic studies and white papers on smart mobility trends

Primary Research

  • Interviews with city planners and transportation officials in major Spanish cities
  • Surveys with bike-sharing operators and service providers
  • Focus groups with end-users to gather insights on user experience and preferences

Validation & Triangulation

  • Cross-validation of findings through multiple data sources, including government and private sector reports
  • Triangulation of user feedback with operational data from bike-sharing systems
  • Sanity checks conducted through expert panel reviews and stakeholder consultations

Phase 2: Market Size Estimation1

Top-down Assessment

  • Estimation of the total addressable market based on urban population density and commuting patterns
  • Segmentation of the market by city size, demographics, and usage frequency
  • Incorporation of government initiatives promoting sustainable transport solutions

Bottom-up Modeling

  • Collection of operational data from existing bike-sharing systems to establish usage metrics
  • Cost analysis based on pricing models and service offerings of bike-sharing operators
  • Volume estimates derived from user registrations and trip data

Forecasting & Scenario Analysis

  • Multi-variable regression analysis incorporating factors such as urbanization rates and environmental policies
  • Scenario modeling based on potential changes in consumer behavior and regulatory frameworks
  • Development of baseline, optimistic, and pessimistic forecasts through 2030

Phase 3: CATI Sample Composition1

Scope Item/SegmentSample SizeTarget Respondent Profiles
Urban Mobility Stakeholders100City Planners, Transportation Officials
Bike-Sharing Operators60Business Development Managers, Operations Directors
End-Users of Bike-Sharing Services120Commuters, Tourists, Local Residents
Policy Makers and Regulators50Government Officials, Environmental Advocates
Technology Providers for Smart Mobility40Product Managers, Technology Developers

Frequently Asked Questions

What is the current value of the Spain Smart Mobility Bike-Sharing Systems Market?

The Spain Smart Mobility Bike-Sharing Systems Market is valued at approximately USD 385 million, reflecting significant growth driven by urbanization, government initiatives for sustainable transport, and increased consumer awareness of environmental issues.

Which cities are leading in the bike-sharing market in Spain?

What types of bikes are available in Spain's bike-sharing systems?

Who are the primary users of bike-sharing systems in Spain?

Other Regional/Country Reports

Indonesia Smart Mobility Bike-Sharing Systems Market

Malaysia Smart Mobility Bike-Sharing Systems Market

KSA Smart Mobility Bike-Sharing Systems Market

APAC Smart Mobility Bike-Sharing Systems Market

SEA Smart Mobility Bike-Sharing Systems Market

Vietnam Smart Mobility Bike-Sharing Systems Market

Why Buy From Us?

Refine Robust Result (RRR) Framework

What makes us stand out is that our consultants follow Robust, Refine and Result (RRR) methodology. Robust for clear definitions, approaches and sanity checking, Refine for differentiating respondents' facts and opinions, and Result for presenting data with story.

Our Reach Is Unmatched

We have set a benchmark in the industry by offering our clients with syndicated and customized market research reports featuring coverage of entire market as well as meticulous research and analyst insights.

Shifting the Research Paradigm

While we don't replace traditional research, we flip the method upside down. Our dual approach of Top Bottom & Bottom Top ensures quality deliverable by not just verifying company fundamentals but also looking at the sector and macroeconomic factors.

More Insights-Better Decisions

With one step in the future, our research team constantly tries to show you the bigger picture. We help with some of the tough questions you may encounter along the way: How is the industry positioned? Best marketing channel? KPI's of competitors? By aligning every element, we help maximize success.

Transparency and Trust

Our report gives you instant access to the answers and sources that other companies might choose to hide. We elaborate each steps of research methodology we have used and showcase you the sample size to earn your trust.

Round the Clock Support

If you need any support, we are here! We pride ourselves on universe strength, data quality, and quick, friendly, and professional service.

Why Clients Choose Us?

400000+
Reports in repository
150+
Consulting projects a year
100+
Analysts
8000+
Client Queries in 2022